
 Motor Controls Documentation
License
return to indexLaserVision Motor Controls
Copyright © 1991-2015, LaserVision. All rights reserved.
Redistribution and use in source and binary forms, with or without modification, are permitted provided that the following conditions are met:
- Redistributions of source code must retain the above copyright notice, this list of conditions and the following disclaimer.
- Redistributions in binary form must reproduce the above copyright notice, this list of conditions and the following disclaimer in the documentation and/or other materials provided with the distribution.
THIS SOFTWARE IS PROVIDED BY THE COPYRIGHT HOLDERS AND CONTRIBUTORS "AS IS" AND ANY EXPRESS OR IMPLIED WARRANTIES, INCLUDING, BUT NOT LIMITED TO, THE IMPLIED WARRANTIES OF MERCHANTABILITY AND FITNESS FOR A PARTICULAR PURPOSE ARE DISCLAIMED. IN NO EVENT SHALL THE COPYRIGHT HOLDER OR CONTRIBUTORS BE LIABLE FOR ANY DIRECT, INDIRECT, INCIDENTAL, SPECIAL, EXEMPLARY, OR CONSEQUENTIAL DAMAGES (INCLUDING, BUT NOT LIMITED TO, PROCUREMENT OF SUBSTITUTE GOODS OR SERVICES; LOSS OF USE, DATA, OR PROFITS; OR BUSINESS INTERRUPTION) HOWEVER CAUSED AND ON ANY THEORY OF LIABILITY, WHETHER IN CONTRACT, STRICT LIABILITY, OR TORT (INCLUDING NEGLIGENCE OR OTHERWISE) ARISING IN ANY WAY OUT OF THE USE OF THIS SOFTWARE, EVEN IF ADVISED OF THE POSSIBILITY OF SUCH DAMAGE.
CLAPACK
Copyright (c) 1992-2011 The University of Tennessee and The University of Tennessee Research Foundation. All rights reserved.
Copyright (c) 2000-2011 The University of California Berkeley. All rights reserved.
Copyright (c) 2006-2011 The University of Colorado Denver. All rights reserved.
Redistribution and use in source and binary forms, with or without modification, are permitted provided that the following conditions are met:
- Redistributions of source code must retain the above copyright notice, this list of conditions and the following disclaimer.
- Redistributions in binary form must reproduce the above copyright notice, this list of conditions and the following disclaimer listed in this license in the documentation and/or other materials provided with the distribution.
- Neither the name of the copyright holders nor the names of its contributors may be used to endorse or promote products derived from this software without specific prior written permission.
The copyright holders provide no reassurances that the source code provided does not infringe any patent, copyright, or any other intellectual property rights of third parties. The copyright holders disclaim any liability to any recipient for claims brought against recipient by any third party for infringement of that parties intellectual property rights.
THIS SOFTWARE IS PROVIDED BY THE COPYRIGHT HOLDERS AND CONTRIBUTORS "AS IS" AND ANY EXPRESS OR IMPLIED WARRANTIES, INCLUDING, BUT NOT LIMITED TO, THE IMPLIED WARRANTIES OF MERCHANTABILITY AND FITNESS FOR A PARTICULAR PURPOSE ARE DISCLAIMED. IN NO EVENT SHALL THE COPYRIGHT OWNER OR CONTRIBUTORS BE LIABLE FOR ANY DIRECT, INDIRECT, INCIDENTAL, SPECIAL, EXEMPLARY, OR CONSEQUENTIAL DAMAGES (INCLUDING, BUT NOT LIMITED TO, PROCUREMENT OF SUBSTITUTE GOODS OR SERVICES; LOSS OF USE, DATA, OR PROFITS; OR BUSINESS INTERRUPTION) HOWEVER CAUSED AND ON ANY THEORY OF LIABILITY, WHETHER IN CONTRACT, STRICT LIABILITY, OR TORT (INCLUDING NEGLIGENCE OR OTHERWISE) ARISING IN ANY WAY OUT OF THE USE OF THIS SOFTWARE, EVEN IF ADVISED OF THE POSSIBILITY OF SUCH DAMAGE.
Open Sans
Open Sans copyright 2010 Steve Matteson
Licensed under the Apache License, Version 2.0 (the "License"); you may not use this file except in compliance with the License. You may obtain a copy of the License at
http://www.apache.org/licenses/LICENSE-2.0
Unless required by applicable law or agreed to in writing, software distributed under the License is distributed on an "AS IS" BASIS, WITHOUT WARRANTIES OR CONDITIONS OF ANY KIND, either express or implied. See the License for the specific language governing permissions and limitations under the License.
Bitstream Vera Fonts
Copyright (c) 2003 by Bitstream, Inc. All Rights Reserved. Bitstream Vera is a trademark of Bitstream, Inc.
Permission is hereby granted, free of charge, to any person obtaining a copy of the fonts accompanying this license ("Fonts") and associated documentation files (the "Font Software"), to reproduce and distribute the Font Software, including without limitation the rights to use, copy, merge, publish, distribute, and/or sell copies of the Font Software, and to permit persons to whom the Font Software is furnished to do so, subject to the following conditions:
The above copyright and trademark notices and this permission notice shall be included in all copies of one or more of the Font Software typefaces.
The Font Software may be modified, altered, or added to, and in particular the designs of glyphs or characters in the Fonts may be modified and additional glyphs or characters may be added to the Fonts, only if the fonts are renamed to names not containing either the words "Bitstream" or the word "Vera".
This License becomes null and void to the extent applicable to Fonts or Font Software that has been modified and is distributed under the "Bitstream Vera" names.
The Font Software may be sold as part of a larger software package but no copy of one or more of the Font Software typefaces may be sold by itself.
THE FONT SOFTWARE IS PROVIDED "AS IS", WITHOUT WARRANTY OF ANY KIND, EXPRESS OR IMPLIED, INCLUDING BUT NOT LIMITED TO ANY WARRANTIES OF MERCHANTABILITY, FITNESS FOR A PARTICULAR PURPOSE AND NONINFRINGEMENT OF COPYRIGHT, PATENT, TRADEMARK, OR OTHER RIGHT. IN NO EVENT SHALL BITSTREAM OR THE GNOME FOUNDATION BE LIABLE FOR ANY CLAIM, DAMAGES OR OTHER LIABILITY, INCLUDING ANY GENERAL, SPECIAL, INDIRECT, INCIDENTAL, OR CONSEQUENTIAL DAMAGES, WHETHER IN AN ACTION OF CONTRACT, TORT OR OTHERWISE, ARISING FROM, OUT OF THE USE OR INABILITY TO USE THE FONT SOFTWARE OR FROM OTHER DEALINGS IN THE FONT SOFTWARE.
Except as contained in this notice, the names of Gnome, the Gnome Foundation, and Bitstream Inc., shall not be used in advertising or otherwise to promote the sale, use or other dealings in this Font Software without prior written authorization from the Gnome Foundation or Bitstream Inc., respectively. For further information, contact: fonts at gnome dot org.
Arev Fonts
Copyright (c) 2006 by Tavmjong Bah. All Rights Reserved.
Permission is hereby granted, free of charge, to any person obtaining a copy of the fonts accompanying this license ("Fonts") and associated documentation files (the "Font Software"), to reproduce and distribute the modifications to the Bitstream Vera Font Software, including without limitation the rights to use, copy, merge, publish, distribute, and/or sell copies of the Font Software, and to permit persons to whom the Font Software is furnished to do so, subject to the following conditions:
The above copyright and trademark notices and this permission notice shall be included in all copies of one or more of the Font Software typefaces.
The Font Software may be modified, altered, or added to, and in particular the designs of glyphs or characters in the Fonts may be modified and additional glyphs or characters may be added to the Fonts, only if the fonts are renamed to names not containing either the words "Tavmjong Bah" or the word "Arev".
This License becomes null and void to the extent applicable to Fonts or Font Software that has been modified and is distributed under the "Tavmjong Bah Arev" names.
The Font Software may be sold as part of a larger software package but no copy of one or more of the Font Software typefaces may be sold by itself.
THE FONT SOFTWARE IS PROVIDED "AS IS", WITHOUT WARRANTY OF ANY KIND, EXPRESS OR IMPLIED, INCLUDING BUT NOT LIMITED TO ANY WARRANTIES OF MERCHANTABILITY, FITNESS FOR A PARTICULAR PURPOSE AND NONINFRINGEMENT OF COPYRIGHT, PATENT, TRADEMARK, OR OTHER RIGHT. IN NO EVENT SHALL TAVMJONG BAH BE LIABLE FOR ANY CLAIM, DAMAGES OR OTHER LIABILITY, INCLUDING ANY GENERAL, SPECIAL, INDIRECT, INCIDENTAL, OR CONSEQUENTIAL DAMAGES, WHETHER IN AN ACTION OF CONTRACT, TORT OR OTHERWISE, ARISING FROM, OUT OF THE USE OR INABILITY TO USE THE FONT SOFTWARE OR FROM OTHER DEALINGS IN THE FONT SOFTWARE.
Except as contained in this notice, the name of Tavmjong Bah shall not be used in advertising or otherwise to promote the sale, use or other dealings in this Font Software without prior written authorization from Tavmjong Bah. For further information, contact: tavmjong @ free . fr.
Additional Notices
Windows is a registered trademark of Microsoft Corporation in the United States and other countries.
LabVIEW is a trademark of National Instruments. Neither LaserVision, nor any software programs or other goods or services offered by LaserVision, are affiliated with, endorsed by, or sponsored by National Instruments.
System Requirements
return to index- Windows XP SP3 or later
-
MCAPI Required to control system
- DCX-PC100 & DCX-PCI100 – Version 2.23 or later
- MFX-ETH1800 – Version 3.4 or later
Introduction
return to index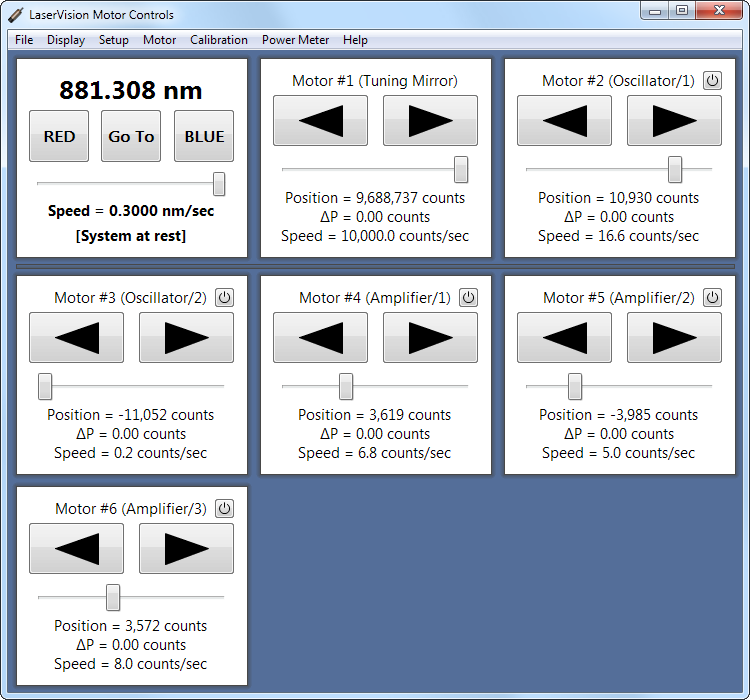
Motor Controls provides synchronous movement of system optics with the purpose of tuning the output to a specific wavelength/wavenumber while maintaining maximum energy: Emax(λ). While this is a multiple dimension problem the basic operation can be thought of in two dimensions. The first is the tuning component, which specifies the output wavelength/wavenumber in terms of a motor position. The second is the output energy: at every point on the tuning curve there is a continuum of possible energies (zero to Emax(λ)).
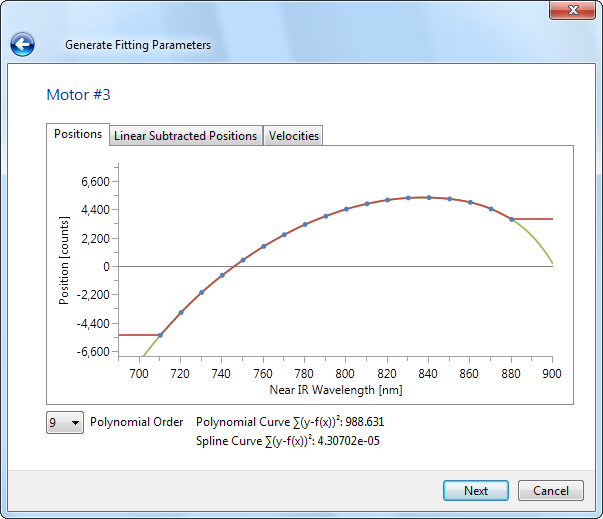
In order to solve this multidimensional surface for Emax(λ) the program uses a fitting curve for each motor. These curves specify motor positions relative to near-IR signal wavelength and can be defined by either a polynomial of up to 9ᵗʰ order or a cubic spline. In most systems the tuning is controlled by the motor closest to the entrance aperture while all other motors optimize the energy output.
Controls Overview
return to indexScanning
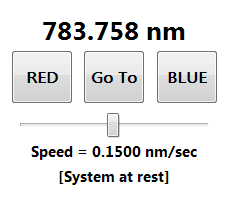
The scanning window (Figure 2) controls synchronized movement of the system as defined by the polynomial or cubic spline fitting parameters. Continuous scanning is started using the RED (lower energy) and BLUE (higher energy) buttons. To scan to a specific wavelength/wavenumber use the Go To button. The tuning speed of a scan is the product of the scanning base speed and the speed multiplier set by the slider and is always specified in Near IR wavelength/wavenumbers. The operating mode, base speed, and max multiplier can be adjusted in the scanning setup dialog.
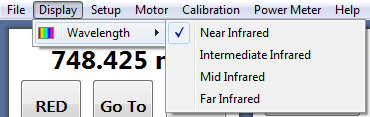
While the system outputs multiple spectral components (Near IR, Intermediate IR, Mid IR, & Far IR) only one of these values is shown in the Scanning window at a time. To change the displayed component use the Display - Wavelength menu selection (Figure 3). Changing the display wavelength mode changes both the values shown to the user and the values entered in the Go To dialog; external commands are not affected by this setting. Please note that scanning speeds can only be set in terms of Near IR values.
| Key | Command |
|---|---|
| R | Momentary scan red |
| G | Scan to a chosen output |
| B | Momentary scan blue |
| ↑ | Increase scanning speed |
| ↓ | Decrease scanning speed |
 |
Adjust scanning speed |
 |
Context menu |
Motors
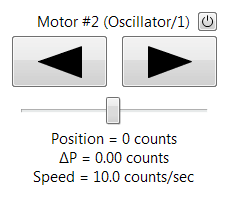
A separate control is provided for each motor (Figure 4). Motors are labeled with a number corresponding to the relative position of the motor/crystal combination in the beam path, starting from the entrance aperture. For many systems this means motors 1 and 2 comprise the oscillator stage while 4-6 make up the amplifier stage. Consult your system manual to determine if your numbering differs from this scheme. An optional identifier may follow the motor designation and is enclosed in parenthesis.
Each control window contains two directional buttons; a power button; a speed slider; and displays the current position, speed, and offset from the desired position according to the fitting parameters (∆P). The right-arrow button moves the motor in the forward (clockwise) direction while the left-arrow button moves the motor in the reverse (counterclockwise) direction. Using either button will begin movement that will continue until the button is clicked again or other movement is initiated. For fine position adjustment the left and right arrow keys can be used to momentarily move the motor while the key is depressed. When in motion the button corresponding to the direction of movement is highlighted green. Scans will be disabled if the tuning motor becomes disabled, either through exceeding a position limit, using the motor window power button, or a controller axis failure.
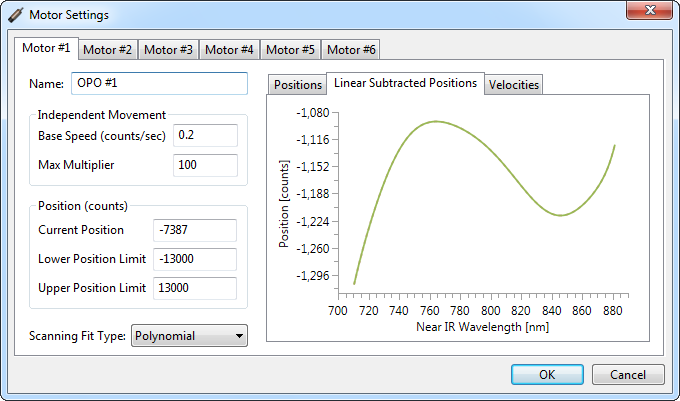
In individual movement the speed of the motor is the product of two quantities: the motor base speed and the speed multiplier set by the slider. The base speed is the speed at which the motor will move during individual movement with the slider in the far left position (multiplier = 1). The speed multiplier is controlled by the slider and allows quick speed adjustments during individual movement. Motor base speeds and max multiplier values are set in the motor setup dialog (Figure 5).
During a scan the speed of the motors are controlled by the fitting parameters. During this time the slider is inactive and the displayed speed is either the instantaneous or average speed of the motor as set by the scan. To toggle between instantaneous and average display modes select the appropriate option from the menu.
Motor positions are relative integers used by the controller to keep track of motion. They do not inherently correspond to any specific angular position and so must be precisely monitored by the program. Positions are saved to POSITION.MOT 15 seconds after motor movement ends (default wait, see POS_SAVE_WAIT), as well as when closing the program. Upon each successful write to POSITION.MOT a backup, POSITION.BAK, is made by copying the POSITION.MOT file.
| Key | Command |
|---|---|
| → | Momentary forward movement |
| ← | Momentary reverse movement |
| ↑ | Increase individual movement speed |
| ↓ | Decrease individual movement speed |
|
Adjust individual movement speed |
|
Context menu |
Motor Errors
Systems with a MultiFlex Ethernet motion controller provide additional error detection than systems using the DCX family of PCI or ISA controllers. The custom amplifiers used with MultiFlex systems also provide additional error feedback compared with the DCX-MC110 modules. Any errors which occur and require user attention are displayed in the motor windows, cancel any active motion, and disable the motor until it is reactivated by the user. Errors are summarized in the following table:
| Error Text | Description | Required Action |
|---|---|---|
| Following | The difference between the desired and actual motor positions is larger than accepted by the program. Usually this results from bad internal wiring or from a damaged motor. | Reactivate the motor and continue normal operation. If the problem persists contact LaserVision for support. |
| Encoder | The motor encoder has encountered an error. | Reactivate the motor and continue normal operation. If the problem persists the motor needs to be replaced. |
| Amplifier | The motor amplifier has encountered a current or thermal limit and was deactivated to prevent damage. Amplifiers share fault signals between two motors so an amplifier fault will always deactivate two motors. | The most common error is the result of a current limit resulting from improper motor movement. Check to ensure motors and scans are within recommended speed limits by opening the corresponding settings windows and cancelling the dialog. A warning will be shown if the base speed is too large to be safe. If an improper speed setting is not the cause of the error check the temperature of the motion controller enclosure, it should be cool to the touch and have the vents free of any obstruction. If the error persists contact LaserVision. |
| Unknown Error | The controller has reported an error on the corresponding axis but the specific error is either not specified or not recognized by the program. | Reactivate the motor and continue normal operation. If the problem persists contact LaserVision for support. |
View Fits
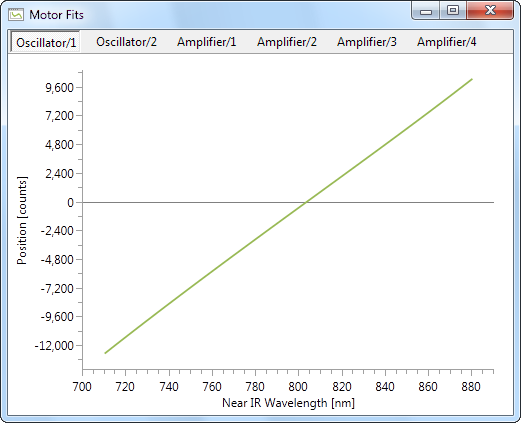
To view the fitting curves open the View Fits window from the menu or press Ctrl + F. Each motor has three views: positions, positions with the linear component subtracted, and velocities. To change between these select the desired view from the context menu of the chart. The chart legend is also viewed from this menu.
| Key | Command |
|---|---|
|
Context menu |
Diagnostics
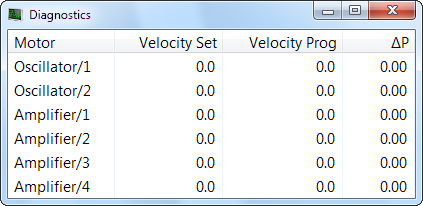
The Diagnostics window displays the current motor velocity (Velocity Set), the desired velocity as calculated from the fitting parameters (Velocity Prog), and the difference in actual vs. desired position as determined by the fitting parameters (∆P). Velocity Set differs from Velocity Prog in that the Set value includes a correction calculated from the ∆P of each motor. Unless ∆P is large both velocities should be close in value.
| Key | Command |
|---|---|
|
Context menu |
Scanning
return to indexOverview
Scanning operations are any synchronized movement of the motors in the red, blue, or go-to-defined directions. Scans are the principle function of the program and are controlled by tuning curves which define motor positions relative to near-IR output wavelengths for each motor. In the case of the tuning motor this relationship is inverted to determine the current output. All other motors use this output wavelength/wavenumber to determine the required positions. This movement scheme means that the motor positions are relative and have no inherent physical meaning. Because of this all motor movement must be recorded by the program of the crystals will move out of alignment. Positions are saved to POSITION.MOT 15 seconds after motor movement ends (default wait, see POS_SAVE_WAIT), as well as when closing the program. Upon program startup positions are restored from this file. Because it is vital to correct operation this file should not be modified. A backup copy is saved in POSITION.BAK after every successful write for added redundancy.
The algorithm used to invert the fitting curve for the tuning motor is Newton's Method. If the inversion fails Ridder's Method will be tried. If Ridder's method also fails a final attempt will be made using Brent's method. The bounds used by the program for this algorithm are 20 nm (near-IR) outside the min and max scanning range when using a polynomial fit, or 20 nm outside the spline data range when using a spline fit.
A scan is initiated using the RED, BLUE, or Go To buttons on the scanning window. Use the Go To button to specify a wavelength/wavenumber target. After any scanning operation the program will wait two seconds for the motors to stop before it attempts to correct ∆P values to within half a count. If a motor is deactivated during a scan it won’t be moved and its ∆P will be reset to zero upon reactivation.
To determine the desired position of non-tuning motors the near-IR output is first calculated from the tuning motor. This value is then used to calculate the desired position for each motor. The difference between actual and desired positions is ∆P. During a scan motor velocities are set using a combination of the curve defined velocity and the ∆P. In this way any residual error left from a previous scan is incorporated into future movement. However, if a motor is individually moved outside of a scan the position is taken as accurate. For instance, if it is suspected that one motor is out of alignment by a constant offset over all wavelengths then the offset would be corrected by individually moving the motor to correct this before any subsequent scanning operations. While the ∆P value will show a non-zero number before the next scan it will be reset to zero upon starting the operation.
Fitting curves can be defined by either a polynomial of up to 9ᵗʰ order or a cubic spline.
Fit Types
There are two fitting types supported by the program: 9ᵗʰ order polynomial and cubic spline. Both define motor positions relative to the near-IR output wavelength in nanometers. The polynomial fit is in the form:
Position = C₀ + C₁(λ-λ₀) + C₂(λ-λ₀)² + C₃(λ-λ₀)³ + C₄(λ-λ₀)⁴ + …
Where Cn is the nᵗʰ order coefficient, λ is the wavelength, and λ₀ is a wavelength offset used to center the equation around 0 (for calculation purposes). Coefficients are stored in the file specified by the [MODEL]DATAFILE value in the settings file. This file has the form:
Motor #1
L0  800.000
C0 -3.89400778501360e+002
C1 +1.31746673773048e+002
C2 -1.37001809451256e-002
C3 +4.38896121152274e-004
C4 +1.16515039008639e-006
C5 +3.83401820720044e-009
C6  0.
C7  0.
C8  0.
C9  0.

Motor #2
.
.
.
Sample polynomial fitting file
The polynomial coefficient definitions begin with a motor heading in the form Motor #N, followed by a line with the λ₀ offset term and then the coefficients. Coefficients should have 15 significant digits to ensure the most accurate fit. While all 10 coefficients must be specified zero is an acceptable value.
While the polynomial fit accurately models the behavior of the tuning mirror the second oscillator stage crystal (not present in all systems) exhibits complex behavior that is more difficult to model (Figure 8). To get around this difficulty the option has been created to apply a cubic spline fit using 15-200 wavelength-position data pairs. Using the spline fit it is possible to achieve sub-nanometer control of the scanning.
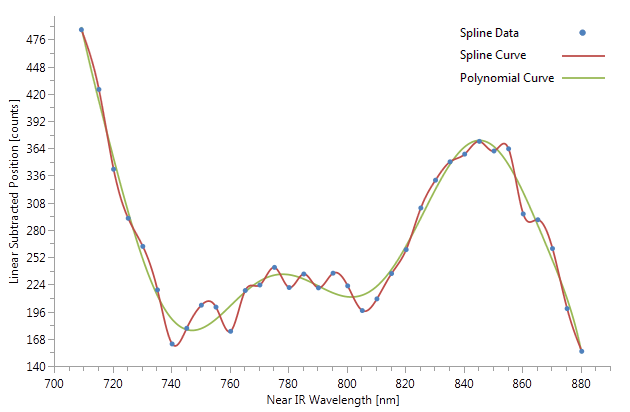
The cubic spline fit interpolates a cubic function for the desired motors on each motor position update. The spline fitting guarantees a smooth and continuous function for both position and velocity, and a continuous function for the second derivative. Because it is only possible to interpolate when two points exist on either side of the calculation wavelength attention should be paid to the outer two points when constructing the cubic spline data file. Except for the tuning motor the cubic spline velocity beyond the first and last data pairs is defined to be zero.
To enable cubic spline fitting a data file must be created in which 15 to 200 wavelength-position pairs are specified, one per line, for each motor which will use the fit. Data pairs must be placed under a text heading of the motor they correspond to (e.g. Motor #2). Motor heading names should use the same Motor #N format as the polynomial fitting file. Additionally, wavelengths must be unique and cover the desired tuning range (see program settings). Specifically, data must exist above the max signal wavelength and below the min signal wavelength or otherwise be within 1 nm of these scan limits. Once these requirements have been met the cubic fit can be enabled for the desired motor(s) in the motor setup dialog. If there is an error in the data file cubic spline fitting will be disabled for the affected motors. It is recommend to use spline fits with a spacing between data points of no more than 7 nm for oscillator stage crystals while 10 nm is sufficient for amplifier stage crystals.
Motor #2
709.004	12719
715.004	11851
720.010	11096
.
.
.
870.009	-9149
875.002	-9882
880.002	-10598

Motor #3
.
.
.
Sample cubic spline fitting file
Fit Generation
return to index
 To generate polynomial and cubic fitting files use the wizard accessed from the menu. Any tab delimited file in the format of MOTPARAM.DAT, created using the Store Wavelength dialog (F4 or Calibration - Record Positions menu item), can be used. Rows must begin with a wavelength and position data must be given in columns of increasing motor number. Not all motors need to have a position value defined for each row, but the column order must be preserved by ending the line early or with tabs. Wavelengths do not have to be in order, and position definitions at a single wavelength can exist on multiple lines. In the case a duplicate wavelength value is used twice to specify a motor position the second position value is used. However, if subsequent wavelengths are within 1 nm of, but not equal to, an already defined wavelength for a motor the subsequent value will be ignored. This is to avoid aberrant spline behavior due to what is likely random noise in the data collection. Note that these caveats are only true on an individual motor basis. For instance, the OPO calibration can be in one section of the file and the OPA calibration in another without data conflicting as long as the OPA data is deleted from the OPO calibration set.
Each motor is initially fit to a 9ᵗʰ order polynomial and λ₀ is automatically calculated to be the center of the defined wavelengths. The user should verify that the calibration data does not include any obviously incorrect data.
Three visualizations of the data are provided. The Positions view displays the trend of the motor and allows for gross errors to be identified. The second, Linear Subtracted Positions, is the position data minus the slope of a linear fit to the data. This emphasizes the non-linear trend of the data and helps identify more subtle mistakes in calibration. A velocity graph is also included and provides for additional data inspection.
In the following sample the OPO and OPA stages have been calibrated separately. The OPO stage data has a 5 nm spacing while the OPA stage for this system was less delicate and was only calibrated every 10 nm. Note that the OPO data has not been removed from the OPA calibration section. While the OPO data in both is almost identical there is some slight variation (0-2 nm). If both OPO/A fits were generated from this file the OPO stage may be slightly miscalibrated because data later in the file doesn’t always override previous data during the fitting process. In practice one would generate fits first from the OPO stage before calibrating the OPA stage and discard the OPO data from the OPA calibration set.
709.004000	-12766	12719
715.004000	-11912	11851
720.010000	-11205	11096
725.006000	-10504	10374
.
.
.
870.009000	8952	-9149
875.002000	9646	-9882
880.002000	10348	-10598
709.004000	-12766	12720	-5876	5729	-5560	5263
720.010000	-11205	11097	-3767	3670	-3505	3199
730.006000	-9807	9674	-2224	2144	-1961	1636
.
.
.
860.000000	7579	-7767	4744	-4875	5008	-5358
870.002000	8951	-9147	4225	-4320	4475	-4802
880.002000	10348	-10597	3344	-3459	3638	-3950
Sample fitting data file
Power Meter Integration
return to indexChart Recorder
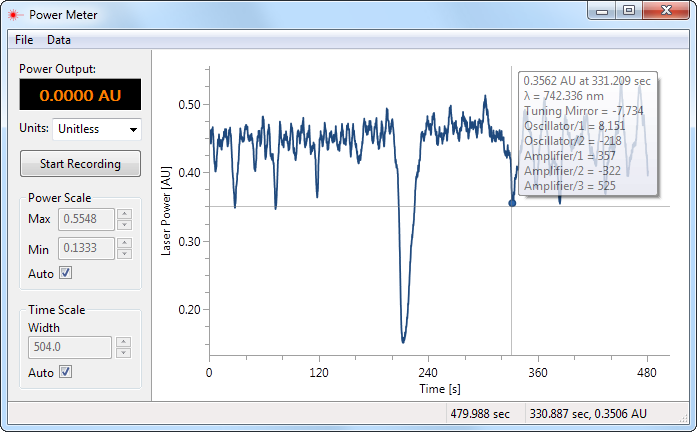 When used with a USB voltmeter from Digital-Measure (also available from LaserVision) the program can interface with the analog output from a laser power meter. This allows power data to be viewed and recorded within the program and more importantly to be associated with the Near-IR output wavelength and motor positions. There are two views for visualizing data: the first is analogous to a chart recorder, the second is a calibration assistant/spectrum viewer. Data collected in both views is identical and the data files can be viewed in both. Data is saved as a CSV file (comma-separated values) and can be visualized using the software or in any number of graphing programs.
The interfaces between both views are very similar. The instantaneous power output is displayed in the top left with the units and scaling factor controlled by the dropdown menu immediately below it. By default the program will display values in arbitrary units (AU) that correspond to the voltage reading from the USB device. To view the data in Watts the software must be configured for the analog voltage output range used by the meter and matched with the current range selection. To set the voltage range use the Power Meter Setup dialog from the menu. The scaling factor is set from the dropdown list immediately below the power output display in either view. If the correct scaling factor isn’t listed it can be entered manually. Unit selections apply to all recorded data in the window, it is not possible to use different ranges in the same recording. Previously saved data that are opened or added to the chart aren’t affected by voltage range or scaling settings.
There are a number of ways to manipulate the chart display. The axes are controlled in the gray toolbar on the left or by using the keyboard and mouse. To zoom select the desired region by holding down the left mouse button and Ctrl at the same time. Alternatively, use the mouse scroll wheel with Ctrl held down. Zoom levels are recorded starting from the unzoomed state. To zoom out one level use Ctrl + Z, or Ctrl + Y to re-zoom. The crosshairs can be used to inspect each data point. To select points by just the x-axis hold Shift with the mouse over the chart. Pan the display by holding the left mouse button and moving the cursor or using the mouse scroll wheel.
| Key | Command |
|---|---|
| Shift | Inspect all curves based on the x-position of the cursor |
 or or |
Pan |
|
Horizontal Scroll |
| Shift + |
Vertical Scroll |
| Ctrl + or Ctrl + |
Zoom |
| Ctrl + Shift + |
Horizontal Only Zoom |
| Ctrl + Alt + |
Vertical Only Zoom |
| Ctrl + Z | Undo zoom |
| Ctrl + Y | Redo zoom |
Motor Calibration / Spectrum
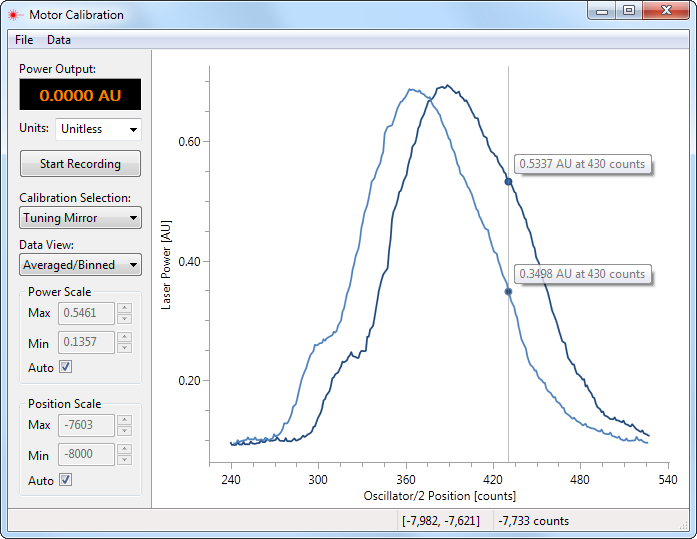 The Motor Calibration / Spectrum interface can be used to aid in system calibration, as a spectrum generator, and is also useful for determining the appropriate motor backlash values (see BACKLASH_N). This mode uses the same data, file format, and interface style as the meter view but plots power vs. motor position/wavelength. Power data can be viewed in three modes: all data, forward/reverse, and binned. In the forward/reverse view each data set has two curves corresponding to motion in the forward and reverse directions. Displayed data is overwritten when the motor passes position already recorded on one of the curves. The binned mode has an adjustable bin size.
| Key | Command |
|---|---|
| Shift | Inspect all curves based on the x-position of the cursor |
| or |
Pan |
|
Horizontal Scroll |
| Shift + |
Vertical Scroll |
| Ctrl + or Ctrl + |
Zoom |
| Ctrl + Shift + |
Horizontal Only Zoom |
| Ctrl + Alt + |
Vertical Only Zoom |
| Ctrl + Z | Undo zoom |
| Ctrl + Y | Redo zoom |
Data Files
Power meter data files are saved as CSV (comma-separated values) text files and can be opened in most common plotting and data processing programs. The first four lines are headings:
[Data Set Name]
[Date Collection Began]
[Time Collection Began]
[Data Set Pump Wavelength]
The following line contains the column headers. Time is specified in seconds (s), power in arbitrary units (AU) or Watts (W), system output in Near-IR wavelength (nm), motor position in counts, and the system status as a bit-field. The system status bits are set according to the same scheme used by the TELLSTAT external command. In previous versions only motor movements were recorded and the column heading was instead named Motor Movement (bit field). Data saved using this older format can still be opened but will lack some newer features.
Laser Power Output
Tuesday, February 11, 2014
13:25:52
Pump Wavelength (nm): 1064.000
Time (s),Power (W),Wavelength (nm),Motor #1,Motor #2,Motor #3,Motor #4,Motor #5,Motor #6,System Status (bit field)
0.000,0.507410,750.052,-7166,7104,703,-660,701,-543,0x0
.
.
.
114.398,0.249636,754.418,-6575,6516,1189,-1119,1185,-999,0x203
Sample fitting data file
Etalon Adjust
return to indexOverview
Note: The Etalon Adjust software is an optional component useful for only a small number of our systems and may not be present.
Etalon Adjust uses etalon interference images to automate either adjustment of the OPO/OPA’s main cavity length to maintain single-mode laser operation, or narrow the line-width of unseeded output, depending on the system. In single-mode systems the adjustment is accomplished using a piezo actuator; for unseeded systems a motor is used.
In an etalon image there are two classes of rings: main rings which represent the predominant transverse mode and fringe rings which represent the contribution of other less dominant modes. To determine the appropriate adjustment a rectangular portion of the etalon image is selected where the curvature of the rings is negligible. The pixels in this region are then summed by column and that with the greatest sum is taken to represent a main ring. The region is then examined for fringe rings and an adjustment is made based on the relative fringe intensities with the goal of either eliminating the fringe rings or equalizing their intensities.
Because the location of the interference rings is extremely sensitive to wavelength it is necessary that scanning operations are done at rate that produces a change of only a few pixels per second in the position of the main ring. Large changes in the position of the main ring will be ignored, so during a speedier scan no adjustment will be made.
Controls
Initial Screen
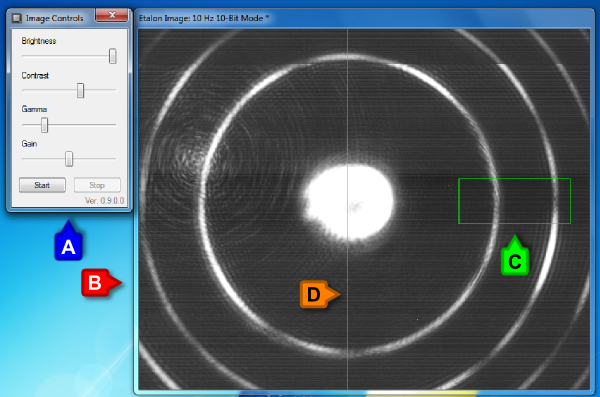 The initial screen (Figure 12) consists of the Image Controls and Etalon Image windows. The Image Controls window (A) contains controls for basic camera properties and during Adjustment Mode is where the ring detection parameters are set. The Etalon Image window (B) displays the full image or, depending on the program settings, the region of interest (ROI) defined by the user. The title of this window includes the image capture rate and camera bit level. The presence of an asterisk at the end indicates that the most recent image is displayed (see Balance threshold for when the most recent image would not be displayed). The ROI is drawn as a green box over the image (C), and is adjusted using the mouse. The region defined by the ROI box will be where ring detection takes place. The vertical orange line (D) marks the horizontal center of the rings and must be positioned by the user for proper ring detection. If the ring center is not visible, place this line on the side of the image closest to the center.
Detail Image
In Adjustment Mode a second image window (Figure 13) will be displayed with a detailed view of the ROI. This window also includes indicators for a number of program variables and ring detection markers. Depending on the settings the detail image may take the place of the full etalon image.
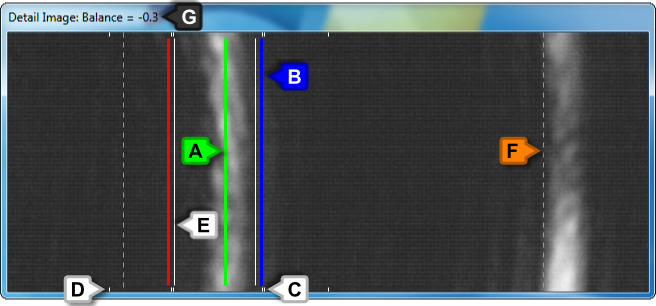
| Feature | Control | Description |
|---|---|---|
| [none] | When detected, the main ring with the greatest intensity is marked by a green line. | |
| [none] | Detected fringe rings will be marked by either a red or a blue line, depending on whether they represent a mode red- or blue-shifted from the main. | |
| L. Min. Limit R. Min. Limit |
The double white lines mark the maximum distance from the main ring to detect the minimum column. | |
| L. Max. Limit R. Max. Limit |
The single white lines (short) mark the maximum distance from the main ring to detect a fringe ring. | |
| [none] | This single white (long) marks the column detected as the minimum between the main ring and the left or right minimum limits (D). | |
| Left Offset Right Offset |
Dashed orange lines mark the left and right offsets that define the region of the ROI in which a main ring will be detected. The area enclosed by these lines should be just wider than the spacing between the main rings. | |
| [none] | The window text of the detail image indicates the current average balance. |
Image Controls - Initial View
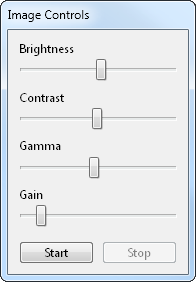
Upon starting the program the image controls will initially be in the state shown in Figure 14. These control the image display and should be tuned for maximum ring clarity before entering Adjustment Mode. It is recommended to adjust the gain last as increasing it past 1x will introduce noise from the camera sensor. Clicking on the “Start” button will enter Adjustment Mode and begin device adjustment.
Image Controls - Adjustment Mode
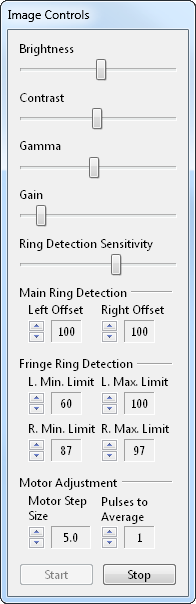
In Adjustment Mode the Image Controls window is expanded (Figure 15) to include additional options specific to ring detection in the ROI. Clicking “Stop” will leave Adjustment Mode and return the controls to their initial state.
- Ring Detection Sensitivity
-
Fringe ring detection is accomplished by summing the pixels in each column between the auto-detected minimum column (Fig. 11: long white line) and the user defined maximum offsets from the main ring (Fig. 11: short single white line). The column with the maximum sum in this region is taken as a potential fringe ring. By adjusting the Ring Detection Sensitivity the user can control how intense a fringe ring needs to be before being recognized by the program, allowing background noise to be filtered out. The Ring Detection Sensitivity is also used in a similar fashion to determine whether or not the column with the maximum sum in the ROI (inside the left and right offset, see Main Ring Detection) qualifies as a main ring. However, since the main ring is by definition more intense than the fringe rings this control should primarily be used to adjust fringe ring detection.
In some cases we've found that the best performance occurs with the sensitivity set to maximum. By constantly monitoring the background there is no lag between the appearance of a fringe ring and the accompanying adjustment. The potential drawback of this method is that the program makes an overcorrection which introduced a fringe ring.
- Main Ring Detection
-
Detection of the main ring is restricted to the region of the ROI between the left and right offsets (Fig. 11: dashed orange lines). Defining this region within the ROI helps to ensure the program doesn't needlessly jump between main rings. These offsets should be set so that the enclosed region is just wider than the spacing between the main rings.
The left and right offsets are also tied to the maximum fringe ring detection limits. Decreasing the ring offset lower than the corresponding max fringe ring limit will automatically decrement the limit. Similarly, increasing the max detection limits past the corresponding offset value will automatically increment the offset.
- Fringe Ring Detection
-
These controls define the region in which a fringe ring will be detected. The left and right minimum limit controls determine the maximum distance from the main ring to detect the minimum column (Fig. 11: long white line). The maximum controls determine the furthest distance from the main ring in which a fringe ring will be detected. Fringe ring detection is a two-step process: first the ROI column sums are scanned for the minimum value on either side of the main ring and within the left/right minimum limits. This column is identified as the left/right minimum and marked with a long white line (Fig. 11: E). Next, the column sums are scanned for the maximum value between the left/right minimum column and the left/right maximum limit. This column is identified as a potential fringe. Whether or not this column is recognized as a fringe ring by the software is controlled by the Ring Detection Sensitivity.
- Device Adjustment
-
After averaging the number of balance measurements set by the Pulses to Average control the program will, if necessary, make an adjustment of magnitude proportional or equal to (see Proportional adjustment) that defined by the Voltage/Motor Step Size control. An adjustment is made only if the ratio of the fringe ring intensities (the balance) is greater than the balance threshold. See Etalon Adjust - Settings for more details.
Recommended Usage
While the software was tuned prior to shipping it may be necessary to perform periodic adjustments in order to maintain optimal performance. The tuning of program parameters for maximum efficacy is complicated by the interrelated nature of many of the variables. For the best results we recommended adjustments are made in the following order:
- Start Etalon Adjust but do not enter Adjustment Mode.
- Adjust the image controls from top to bottom for maximum clarity of both main and fringe rings: brightness, then contrast, then gamma, and finally gain. Gain should be adjusted last as any value above 1x will introduce noise from the camera sensor.
- Press “Start” to enter Adjustment Mode.
- Disable device adjustment by setting the voltage step size to 0. Set the number of pulses to average to 10.
- Position the left and right minimum limits so that they are just inside of where the fringe rings appear. It may be necessary to manually adjust the device to induce a second mode in order to accomplish this.
- Adjust the left and right maximums just outside the region where the fringe rings appear.
- Slowly scan the system and adjust the ring detection sensitivity to a level where the fringe rings are only just detected. Increase the left and right offsets if necessary.
- Piezo-Controller: Stop scanning and adjust the voltage step size until the program is able to maintain desired operation without overcorrection.
Motor: Continue scanning and adjust the motor step size until the program is able to maintain the desired balance without overcorrection. - Adjust the number of pulses to average as desired.
- Begin a frequency scan operation at the speed desired for the current experiment to test the parameters. It may be necessary to adjust certain values to accommodate the differences in ring thickness and distance of the fringe rings from the main ring that occur with varying distance from the center of the image.
- Fine tuning of the Etalon Adjust settings may be required (see Etalon Adjust - Settings)
Piezo Controller
If your system uses a piezo controller the user should familiarize themselves with the operation of the device before using the software. The MDT694A controller has three inputs which combined determine the output voltage: the output adjustment knob, an external voltage input, and the RS-232 commands from the program. We recommended using the controller with the output adjustment knob set to zero (in the counterclockwise-most position) and no external input. This is not strictly necessary, but will give the greatest software tuning range before a voltage rollover occurs (see Voltage rollover offset).
Settings
Additional parameters are available in the Etalon Adjust Settings dialog. Caution should be used when changing these values as the optimal settings were determined for your system prior to shipment.
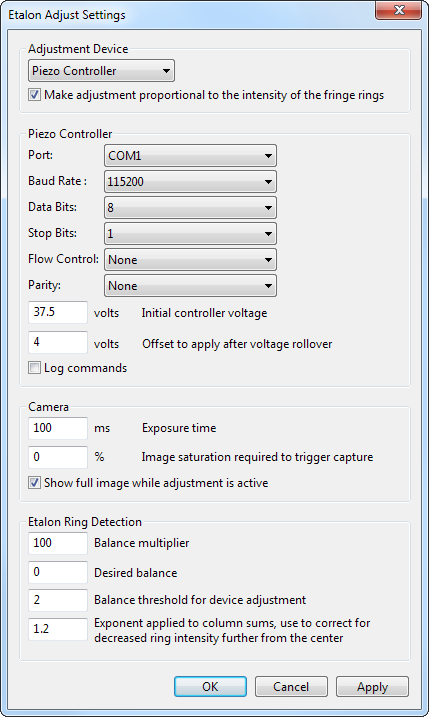
Adjustment Device
- Device
- The software can either adjust a Thorlabs MDT694A piezo controller or a motor, please select the device in use by your system.
- Proportional adjustment
- When not set and the program determines an adjustment is required the value of the Voltage/Motor Step Size control is used as the adjustment to be made. If set, the device adjustments will be made using the Voltage/Motor Step Size multiplied by the ratio of the background corrected intensity of the fringe ring to that of the main ring.
Piezo Controller
Note: Not visible when a motor is selected as the adjustment device
- Initial controller voltage
-
When entering Adjustment Mode the voltage of the piezo controller is set to this value. If scanning is primarily going to be made in the blue direction then a lower value (higher, if scanning red) may give better performance as there will be a longer period before any voltage rollover occurs. It should not be set to a value within the voltage rollover offset of the min or max of the controller’s voltage range (0 V – 75 V).
- Voltage rollover offset
-
When the current voltage adjustment would take the voltage outside the range of the piezo controller the remainder outside the range is added to this value and the voltage is rolled-over to the opposite end of the range. For instance, if the voltage adjustment was -0.5 V, the current voltage was 0 V, the offset of the manual adjustment knob was 0 V, and the voltage rollover offset was 4 V, then the voltage would be set to 70.5 V.
Camera
- Exposure Time (milliseconds)
-
This value should be 100 ms or less to match the 10 Hz frequency of the pump laser. There is no synchronization between the camera and the pump laser so it is not uncommon for underscanning to occur. In underscanning only a partial laser pulse is captured and a black bar is visible in the image. Increasing the exposure time can reduce the size of this bar but may not eliminate it entirely.
Values less than 100 will result in a faster image capture rate. However, due to the processing ability of the camera the time between subsequent image captures is limited to approximately 12 images / sec when showing the full image during adjustment mode. The limit is higher if the full image is not always shown (about 20 images / sec).
- Required Saturation for Image Capture
-
If the exposure time of the camera is less than 100 milliseconds it may be desirable to set a threshold value to cause image captures not meeting a sufficient pixel saturation level to be ignored (not displayed, no adjustments made). The required saturation value is the percentage of the maximum possible pixel sum for the captured image required to trigger the software.
- Show Full Image
-
Showing the full image has the benefit of allowing the user to adjust the region of interest while adjustment is active. A potential drawback is that by requiring the camera to capture the full image, instead of just the region of interest, the maximum achievable frame-rate is reduced.
Etalon Ring Detection
- Balance Multiplier
-
Multiplier applied to raw calculated balance.
- Desired Balance
-
During device adjustment the balance is compared to the desired balance. If the balance is less than or equal to the desired balance a positive adjustment is made, otherwise the adjustment is negative. No adjustment is made if the balance is within the balance threshold value of the desired balance.
- Balance Threshold
-
While in Adjustment Mode the device is only adjusted if the absolute difference between the balance and the balance threshold is greater than the balance threshold.
- Radial Adjustment Power
-
The ROI column sums used for determining the main ring are modified before use by taking them to this value as a power. Because interference rings decrease in intensity as a function of their radius it is necessary to correct for this behavior to favor outer rings, otherwise an outer fringe of a ring exiting the ROI on the inner side may be mistaken as a main ring during scanning. Set to zero to disable this correction.
Settings
return to indexProgram Settings Dialog
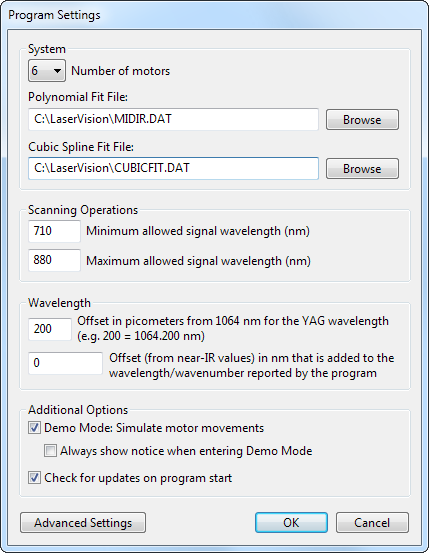 Program settings are adjusted using the Settings dialog accessed from the menu. The options are as follows:
- Number of Motors
-
The number of motors in the system. In most situations it should not be necessary to edit this value, even when controlling a subset of available motors. For example, when tuning the oscillator independent of the amplifier stage it would be more appropriate to deactivate the amplifier motors to decouple the motion.
- Polynomial Fit File
-
The polynomial fitting parameters.
- Cubic Spline Fit File
-
The cubic spline fitting parameters.
- Minimum and Maximum Allowed Signal Wavelengths
-
The minimum and maximum allowed signal wavelengths (in relation to the pump signal) are used to set bounds on go to operations. These values can be adjusted to a portion of the maximum range if desired. Please consult the system documentation for the maximum range of the system. Note that these values limit only Go To operations, Red and Blue scanning operations as well as individual motor movement are not affected by these values. If using cubic spline fits spline data must exist outside of, or otherwise within 1 nm of, these limits.
- Offset from 1064 nm
-
Specifies a picometer offset from 1064 nm. Because of wavelength variation in the 1064 nm output between pump lasers it is necessary to specify a correction value in order for the program to calculate the output wavelength/wavenumber correctly.
- Offset from Near-IR Wavelength
-
An option that allows an offset to be added to the wavelength/wavenumber displayed or returned by the program. This value is in terms of the Near-IR pump signal and allows the wavelength to be adjusted without affecting calibration. This option also offsets the range of allowed Go To values. Note that when calibrating systems with a non-zero offset the collected data may be offset as well. Therefore if such data is used the offset should be reset to zero.
- Demo Mode
-
Demo mode allows for testing of all program functions without actually moving the motors or affecting stored positions. It is recommended that developers of programs which interface with Motor Controls test their applications in Demo mode to avoid unintended system movement.
- Always show Demo Mode Notice
-
If checked the Demo mode notice will be shown whenever entering the mode.
- Startup Update Check
-
By default the program will check for updates when starting and notify the user if one is available. Uncheck this box to disable this feature. Otherwise updates can be checked for by opening the About dialog, which always performs this check.
- Advanced Settings
-
Opens the program settings file (see Settings File) for manual editing. Changes made to this file require a program restart before they take effect and may be overwritten by subsequent changes made in the Settings dialog.
Settings File
Program settings are stored in the Motor Controls.ini file in the same directory as the program. Manual editing of this file is possible but discouraged for most users as it contains additional settings that relate to the system type. Improperly setting some of these additional values may cause permanent damage to system components or improper program function. Settings should instead be changed using the Settings dialog from within the program.
The settings file is an INI file composed of headings enclosed in brackets under which parameters and their values are specified. If a parameter is not specified it is set to the default value; your file may not contain all settings mentioned here. Default values are given in parenthesis.
The [MODEL] Heading
- DEVICE (SIX-MOTORS)
- The number of motors in the system.
- OPTION1 (AgGaSe2)
- Identifies the system type.
- SIG_MIN_WAVELEN (710.)
- Specifies the minimum Go To wavelength in terms of Near-IR pump signal. To be valid spline data must exist below or within 1 nm of this value.
- SIG_MAX_WAVELEN (880.)
- Specifies the maximum Go To wavelength in terms of Near-IR pump signal. To be valid spline data must exist above or within 1 nm of this value.
- DATAFILE (MIDIR.DAT)
- Specifies the name of the file containing the polynomial fitting coefficients.
- CUBIC FIT FILE (CUBICFIT.DAT)
- Specifies the name of the file containing the cubic spline fitting parameters.
- DEMO_MODE (NO)
- When set to YES the application will start in demo mode.
The [SCREEN] Heading
- FONT SIZE (15)
- Allows the font size used by the program to be adjusted.
- STARTUP_UPDATE_CHECK (YES)
- Determines whether or not the program checks for updates on startup.
- LAYOUT (FOUR_COLUMNS)
- Specifies the layout of the main window. A THREE_COLUMNS layout is also supported.
- BACKGROUND_RGB_COLOR (84,110,153)
- Background color of main window.
- HIGHLIGHT_RGB_COLOR (51,153,255)
- Border highlight color for component windows.
- MCHLD_TEXT_RGB_COLOR (0,0,0)
- Text color for component windows.
- MCHLD_BACKGROUND_RGB_COLOR (255,255,255)
- Background color for component windows.
- INVERT_BUTTON_COLORS (NO)
- Colors of main window buttons will be inverted if YES.
The [CONTROL] heading
- 1064_OFFSET (200)
- Offset in picometers from 1064 nm for the YAG wavelength. The default value of 200 sets the YAG wavelength to 1064.200 nm.
- NEAR_IR_WAVELENGTH_CORRECTION (0.)
- An optional offset (from near-IR values) in nm that is added to the wavelength/wavenumber reported by the program.
- POS_SAVE_WAIT (15)
- Approximate time to wait in seconds after all motion ceases before saving motor positions to disk.
The [MOTORS] heading
- BACKLASH_N (0)
- The motor gearhead backlash correction, where N is the motor number (1-8). To determine the required backlash correction value begin by activating the Motor Calibration / Spectrum power meter window. Set the calibration selection to the desired motor and the data view to Forward/Reverse. Move the motor individually (don't scan the system) off the peak in the forward and reverse direction to create a plot similar to Figure 11. The separation on the x-axis between the forward and reverse curves is the required backlash correction value. Make sure to return the motor to the mid-point between the peaks of the power meter curves to return the system to alignment.
- ACCELERATION (auto-detected)
- Motor acceleration, this value is now auto-detected based on the motor controller model.
- GAIN (auto-detected)
- Motor gain, this value is now auto-detected based on the motor controller model.
- V_MULTIPLIER (auto-detected)
- Motor velocity multiplier, this value is now auto-detected based on the motor controller model.
Project Integration
return to indexCommands
The system can be controlled externally over RS-232 or Ethernet. Communications parameters are adjusted in the External Communication dialog available from the menu.
Command arguments are highlighted in amber. Optional arguments are given in parenthesis while those that are required are in brackets. Neither parenthesis, brackets, or the vertical bar should be included when using the command.
- SCRED
- Initiates scanning in the Near-IR red direction (lower energy).
- SCBLUE
- Initiates scanning in the Near-IR blue direction (higher energy).
- SCOFF
- Turns scanning off.
- GOTO [value]
- Initiate scan to value, where value is a Near-IR wavelength or wavenumber depending on the system mode (see SETWL and SETWN below).
- SETSPD ( motor(s) | all ) [value]
- If only one argument is used, the command will set the system scanning speed to value, where value is in Near-IR units of nm/sec or cm⁻¹/sec depending on the system mode (see SETWL and SETWN below). Setting of the scanning speed is accomplished by changing the base scanning speed to: value / (current scanning multiplier).
- If more than one argument is present, the second argument will be used to set the base speed of the specified motor(s). Multiple motors can be specified using commas or all can be set (not including the Scanning window) with all. If the specified motor(s) is/are in motion or a scanning operation is in progress the command will fail.
- Caution: The behavior of the command is different depending on if it is used to affect scans or motors.
- TELLWL
- Returns the current Near-IR wavelength (nm).
- TELLWN
- Returns the current Near-IR wavenumber (cm⁻¹).
- SETWL
- Set the controls to wavelength mode.
- SETWN
- Set the controls to wavenumber mode.
- MOVE [ motor(s) | all ] [ forward | reverse ]
- Moves specified motor(s) in either the forward or reverse direction. Multiple motors can be specified using commas or all can be moved with all. This command will stop any scanning operation currently in progress.
- STOP [ motor(s) | all ]
- Stops the specified motor(s). Multiple motors can be specified using commas or all can be stopped with all. This command will stop any scanning operation currently in progress.
- TELLPOS [ motor(s) | all ]
- Returns the current position of the specified motor(s). Multiple motors can be specified using commas or all can be queried using all. Note that positive as well as negative values are signed in order to differentiate the return from an error code.
- SETSCRL ( motor(s) | all ) [value]
- Sets the scrollbar multiplier of the Scanning window or specified motor(s). If the only argument is a scroll value it will be used to set the Scanning window's scrollbar, otherwise the second argument will be used to set the scrollbar of the specified motor(s). Multiple motors can be specified using commas or all (not including the Scanning window) can be acted on with all.
- TELLSTAT
- Returns the current status of motor movement and any scanning operation as a hexadecimal number, prefixed with "0x". The bits of this number are set according to the following scheme:
For example, the number 0x24a6 in binary is 10010010100110:Bit Meaning 0 Scanning red (Near-IR) 1 Scanning blue (Near-IR) 0 & 1 Reducing motor errors 2N Motor #N is moving in the reverse direction 2N + 1 Motor #N is moving in the forward direction Bit 13 12 11 10 9 8 7 6 5 4 3 2 1 0 Value 1 0 0 1 0 0 1 0 1 0 0 1 1 0 Refers To Motor #6 Motor #5 Motor #4 Motor #3 Motor #2 Motor #1 Scan Status Forward Reverse Stopped Forward Forward Reverse Blue - TELLPWR
- Returns the current laser power as measured by the USB/MultiFlex voltmeter and scaled by the settings specified in the Power Meter Setup dialog. Units are either arbitrary (AU) or Watts (W).
RS-232 Communication
An option to echo all characters sent to the laser control system is enabled by checking the Echo option in the setup dialog box. This is a convenient way to test various features from a remote terminal. If this feature is turned off (as it normally would be for communications with a remote computer) a single '>' character is echoed for each command that is accepted, and a '?' is echoed for an invalid command. For a command that requires a response (TELLWL, TELLWN, and TELLPOS), a '>' character precedes the response. Commands can be terminated by either a carriage return (CR) or line feed (LF) character.
Communicating over RS-232 also offers the ability to be notified upon completion of a Go To operation. From the setup dialog, select "Notify End of Scan" and when the operation has completed DONE will be sent.
In order to use an installed RS-232 port the port must be named "COM#", where # is 1 - 256, and identify itself to Windows as an RS-232 device.
Ethernet Communication
Ethernet communication can be done using TCP and/or UDP protocols over either IPv4 or IPv6. Both TCP and UDP can be enabled at once, and can even use the same port, but only IPv4 or IPv6 can be used with either at a time. Commands are the same as for RS-232 communications. By default, TCP connections will timeout after 5 minutes of inactivity. It is possible to send multiple commands at once (in the same packet) by delimitating separate commands with any character other than a letter, number, comma, decimal point, or space. All commands sent over Ethernet result in an error code being returned, indicating the success or failure of the command. Return messages are terminated with a carriage return (CR) followed by a line feed (LF).
Error Codes
0 - Command successfully processed
1 - Invalid command
2 - Required window not open
3 - Specified value is out-of-range (no action taken)
4 - Specified velocity is outside the range of safe values (no action taken)
5 - A Go To scan is already active, wait for the scan to complete or cancel the current operation with SCOFF
7 - Unable to change setting while motor(s) in motion or scanning operation is in progress
9 - No USB voltmeter detected
MotorSendCmd.exe
An Ethernet communications program, MotorSendCmd.exe, is included and can be integrated into any control software or used on its own to test Ethernet communications. For usage information run the program from the command line without any arguments. MotorSendCmd.exe is designed so that it may be integrated into the operations of a parent program and will return the error code or wavelength/wavenumber/first returned position/status as its process exit code (when sending multiple commands only the result of the final command is returned). For all non-error code returns the value is scaled by a factor of 100,000 so as to preserve decimal precision and/or avoid conflict with an error code. The source code for MotorSendCmd.exe is provided in the .c file of the same name and can be used to achieve a more seamless integration into an external control program. In addition to the above error codes, MotorSendCmd.exe will also return Winsock error codes on an internal Winsock error:
6, 8, 995-11031 - Winsock error code, see Windows Sockets Error Codes (Microsoft) for details.
Ethernet Communications using LabVIEW™
A sample LabVIEW™ program is provided that demonstrates Ethernet communications with Motor Controls. The following list summarizes communication requirements when using LabVIEW™:
- TCP or UDP Read must be called once for every command sent.
- The mode of TCP Read must be "CRLF" and "bytes to read" must be ≥ the number of possible printed character that will be returned + 2. For consistency a value of 100 is recommended for all commands.
Note on using IPv6 with Windows XP
If running Windows XP IPv6 must be installed manually. To install execute the following command from a command prompt window: ipv6 install. See Microsoft article 555577 for more information. No IPv6 installation is necessary with Windows Vista and later.
MultiFlex ETH 1000 Configuration
return to indexIf your system uses an Ethernet based motion controller you may at some point need to reconfigure the device. Those users with controllers internal to the supplied computer can safely ignore this section.
Hardware
For proper operation the MultiFlex ETH 1000 should be configured with the 1800-2-120 configuration. This is the factory-set configuration and should not be altered by the user.
To check the hardware configuration go to the Hardware Configuration Panel on the built-in web server of the controller. If the IP address of the controller has not been changed from the factory settings the address of this page is http://192.168.10.100/hw_config.asp. If the controller hardware is configured correctly the configuration data will be as follows:
| data | value |
|---|---|
| Controller Type | MFX-ETH1800-2 Motion Controller |
| Interconnect Board | ICN-120 |
| Configuration File | mfxeth1800_2_120 |
If the controller has another configuration the program will attempt to dynamically reconfigure the required settings, but this may not always succeed. Please contact LaserVision or PMC for instructions on how to restore the MultiFlex to the 1800-2-120 configuration.
Network
Physical Network Configuration
The computer supplied with the system includes a dedicated network adapter to ensure reliable communication with the MultiFlex. It is possible to connect the device instead to the local network, but since these vary in their properties we cannot guarantee such a setup will work as desired. While the use of TCP guarantees packet delivery to the controller (when connected) there are a number of connection characteristics which affect usability. Successful use of the controller has demands similar to streaming content; it works best when communication is as close to real-time as possible. Connection speed, reliability, latency, and jitter are all important considerations. Additionally, if the controller can be accessed by multiple computers it is possible the saved positions on the supplied computer could become inaccurate if another user moves the motors. In especially noisy environments a shielded network cable may be desirable.
IP Configuration
If the factory set IP addresses conflict with your network you may need to reconfigure the connection. A conflict exists if both the network used by the motion controller and for Internet access share the same subnet.
Computer: MFX-ETH 1000 Network Adapter Default Configuration
| Property | Setting | Remark |
|---|---|---|
| DHCP | Disabled | Not supported by MFX-ETH |
| IPv4 Address | 192.168.10.10 | Address recommended by PMC is 192.168.1.10. However, the 192.168.1.0/24 subnet is commonly used by consumer networking equipment; the 172.16.0.0/12, and 10.0.0.0/8 subnets are commonly used by large institutions. |
| IPv4 Subnet Mask | 255.255.255.0 | Restricts the network adapter to the 192.168.10.0/24 subnet. |
| IPv4 Default Gateway | (not set) | Not necessary to communicate with the MFX-ETH. |
Motion Controller: Default Network Configuration
| Property | Setting | Remark |
|---|---|---|
| IPv4 Address | 192.168.10.100 | Non-default, set by LaserVision |
| IPv4 Subnet Mask | 255.255.255.0 | |
| IPv4 Gateway | Doesn't matter | Only accessible through the Ethernet Tool from PMC. |
If you are unsure of the IP address for your motion controller you can download and run the Ethernet Tool from PMC. Ethernet Tool will search your network for any available MFX-ETH devices, report the current network settings, and allows the settings to be altered.